Energy

CCUS Role in the Transition to Net-Zero: Part 4

Issues for Successful Deployments

By Abigael Eminza and Claudia Nyon

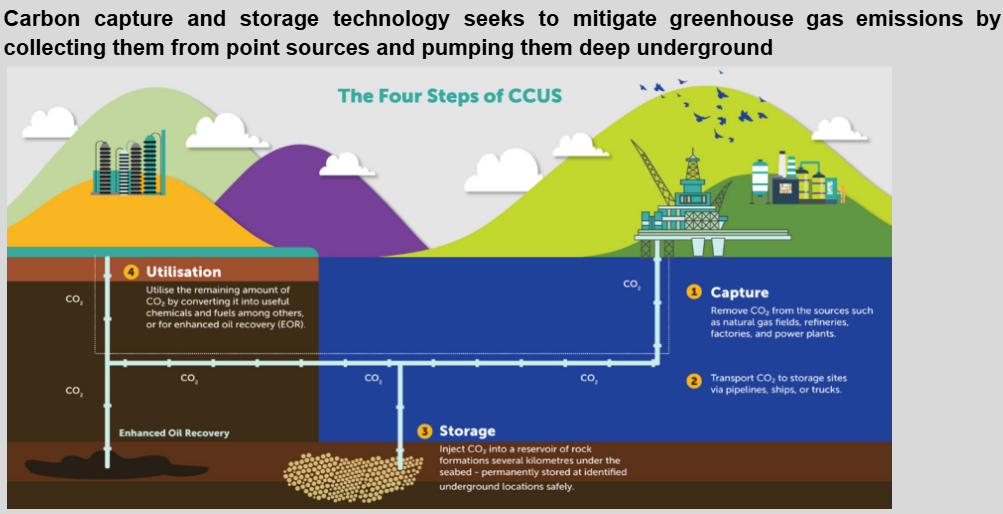
Successful deployment of Carbon Capture, Utilisation and Storage (CCUS) depends not only on technology but also on coherent policy, law, and financial frameworks. Countries like Norway demonstrate that a strong business case, reinforced by carbon pricing and regulatory certainty, is essential to make CCUS cost-competitive and attractive for private investment. At the international level, instruments such as the London Protocol govern cross-border CO2 transport, though gaps remain, particularly in ASEAN and other emerging markets. Fiscal measures, including subsidies, tax incentives, and revenue guarantees, can help overcome the reluctance of businesses to be first movers in new CCS hubs. This section examines the legal, financial, and policy levers required to scale CCUS while highlighting both the potential benefits and inherent challenges.

National Policy and Laws 

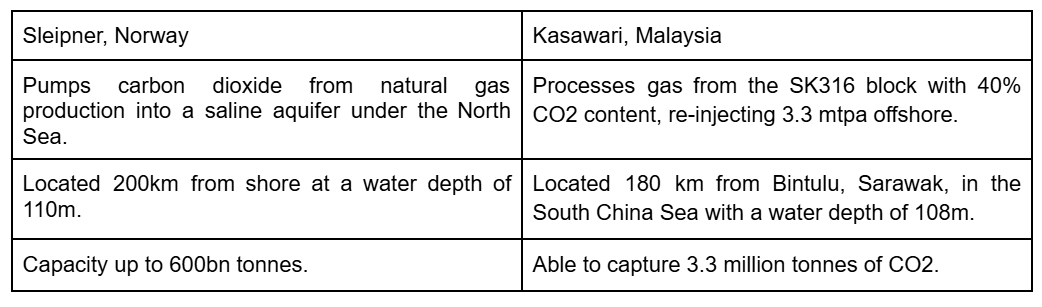
Robust legal frameworks underpin successful CCUS deployment, ensuring that technology can translate into real-world emission reductions. Norway demonstrates how a strong policy environment, anchored by carbon pricing, can make CCUS commercially viable. The Sleipner project, often cited as the world’s first large-scale CCS facility, was made possible by the Norwegian carbon tax on offshore oil and gas, which created a compelling business case for investment (Global CCS Institute). This shows how fiscal levers, such as targeted taxes, incentives, or revenue guarantees, can help overcome market reluctance, especially where pure economic returns are uncertain.

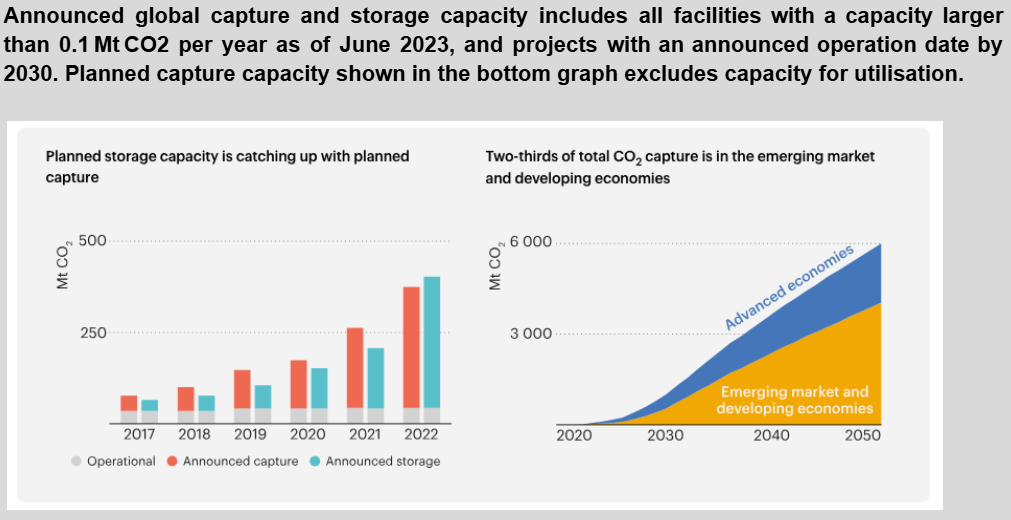
Globally, a persistent challenge lies in the mismatch between planned capture capacity and available storage. Without regulatory certainty, private actors are often reluctant to invest, highlighting the importance of laws that guarantee long-term access and clearly define liability arrangements for CO2 storage (Global CCS Institute). International frameworks, such as the London Protocol, guide cross-border CO2 transport, but limited ratification, particularly in ASEAN and other emerging markets, continues to restrict regional deployment. Bilateral or multilateral agreements may serve as interim solutions, yet broader harmonization is needed to reduce legal uncertainty and enable large-scale projects.

Some countries are beginning to experiment with domestic CCUS legislation. For example, Sarawak enacted a law in 2024 to promote CCUS projects, representing one of the first attempts in ASEAN to integrate CCUS into national energy transition pathways (Laws of Sarawak, 2024). Such legislation must be aligned with international commitments, including the Paris Agreement, to ensure consistency and attract private investment. In addition, developing robust regional standards for measurement, reporting, and verification (MRV) is essential to provide credible, transparent assessments of greenhouse gas reductions (Havercroft et al., 2024; World Bank Group, 2022).

Effective CCUS regulation also requires clearly defined processes and obligations throughout the entire project lifecycle. From planning and exploration to operation, closure, and post-closure, operators must obtain authorisations at key milestones, ensuring accountability and regulatory oversight at every stage (Havercroft et al., 2024). Establishing such frameworks helps create confidence for investors, protects the environment, and provides a predictable pathway for scaling CCUS while balancing technical, financial, and legal considerations.

Hefty CCUS investment is needed globally

Global CCUS deployment requires substantial investment. US$196 billion will be needed through 2034 to support planned CCUS projects worldwide (Wood Mackenzie, 2024).To mobilise this level of funding, a combination of financial and policy mechanisms is critical. Key instruments that can attract private investment and reduce early-stage risks include:

  • Fiscal incentives: This would allow for private finance as “The only means by which a positive return on investment in CCS is achieved is when the service provided by CCS (CO2 emissions abatement) is monetised” (Global CCS Institute, 2021). Incentives, such as subsidies, tax credits, and price support mechanisms, can bridge the gap between technical feasibility and commercial viability (McKinsey & Company, 2022).

  • Tax measures: Targeted tax policies, exemplified by the Sleipner project in Norway, demonstrate how carbon taxation can create a robust business case for investment in CCUS infrastructure, effectively reducing financial risk and encouraging uptake (Global CCS Institute, 2021).

  • Revenue guarantees: Initial investment in CCS hubs and clusters is hindered by first-mover risk. Businesses prefer mature networks where financial returns are more predictable (Williams et al., 2024). Guarantees of revenue or offtake agreements during early project stages can lower this barrier, enabling governments to play a pivotal role in catalysing private sector participation.

Cross-border issues, London Protocol

Several international treaties and protocols provide a legal and regulatory framework relevant to CCUS, particularly for offshore storage and cross-border operations. The London Protocol (2009 amendment) and its predecessor, the London Convention (1972), govern the sub-seabed injection and transboundary transport of CO2 while protecting the marine environment. UNCLOS (1982) establishes general obligations for offshore environmental protection, and the Convention on Biological Diversity (1992) ensures that CCUS activities avoid harming marine ecosystems. The Paris Agreement (2015) sets climate targets that drive CCUS deployment within national mitigation strategies, while IMO regulations oversee the safe maritime transport of captured CO2. Collectively, these instruments provide a patchwork of environmental, safety, and climate obligations, highlighting the need for coordination between international law and national regulations to enable large-scale, legally compliant CCUS projects.

More on the Convention on the Prevention of Marine Pollution by Dumping of Wastes and Other Matter 1972 (or the London Protocol). 

Originally designed for waste management, the London Protocol entered into force on 24 March 2006 and had 54 contracting parties as of September 2023. Article 6 prohibits contracting parties from allowing the export of wastes into the sea, which has been interpreted to include carbon and its cross-border transfer for sub-seabed storage. In response, the Protocol was amended in 2009 to allow cross-border transportation of CO2 for sub-seabed storage, although this amendment has not yet been ratified by two-thirds of contracting parties. It has been suggested that contracting parties could enable transboundary CO2 export through separate treaties (International Energy Agency, 2011).

Despite these legal adjustments, the Protocol provides only a partial framework for CCUS. It establishes environmental safeguards and clarifies responsibilities, which reduces regulatory uncertainty and gives investors greater confidence to develop large-scale CCS hubs. However, its effectiveness is constrained by incomplete ratification, limited adoption in regions such as ASEAN, and its original focus on waste management, leaving gaps in areas like long-term monitoring, liability, and post-closure obligations. To fully enable deployment, countries often need additional national regulations or bilateral agreements, meaning the Protocol serves as a foundational framework rather than a complete solution for international CCUS expansion (International Energy Agency, 2011).

Opportunities and limits of EOR and retrofitting

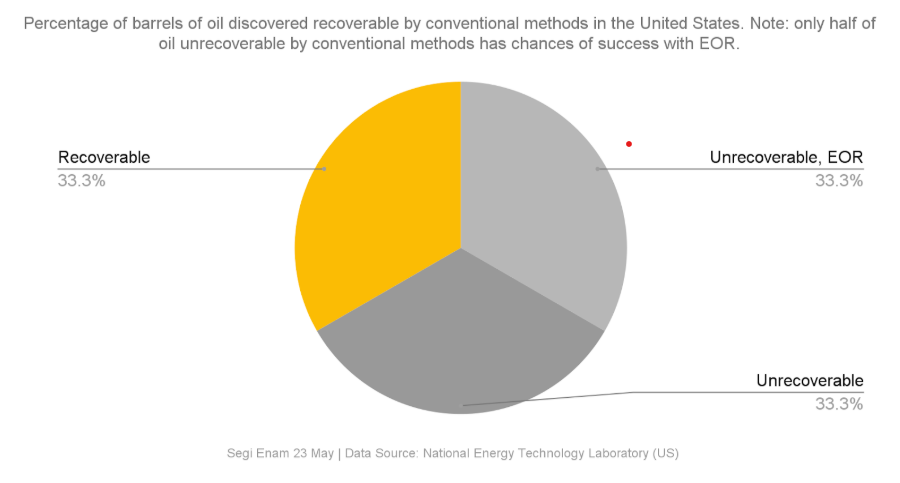
Enhanced Oil Recovery (EOR) can potentially legitimize continued oil consumption and lower prices. Policy support, such as financial incentives for CO2 stored, should be strictly limited to cases where:

  • The combination of the CO2 source and carbon intensity of injection delivers zero or negative net emissions.

  • Captured CO2 is used productively, while EOR using mined CO2 is never supported and ideally discouraged.

  • Overall, oil demand is constrained by ambitious decarbonisation policies applied across end-use sectors.

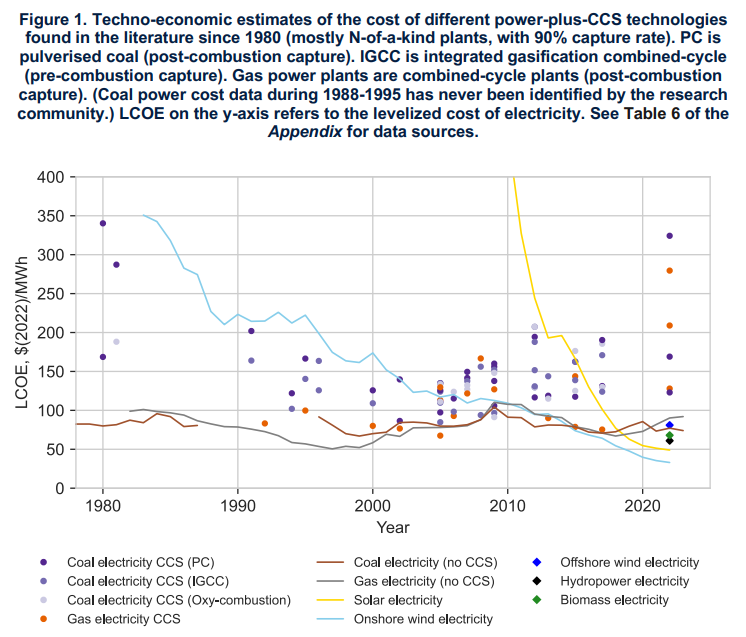
New technologies and improvements are under development for post-combustion, pre-combustion, and oxy-fuel combustion capture systems. It remains unclear which CO2 capture technologies will be the most effective in delivering cost reductions and performance improvements, as several are still in the early stages of development and demonstration (IEA, 2020).

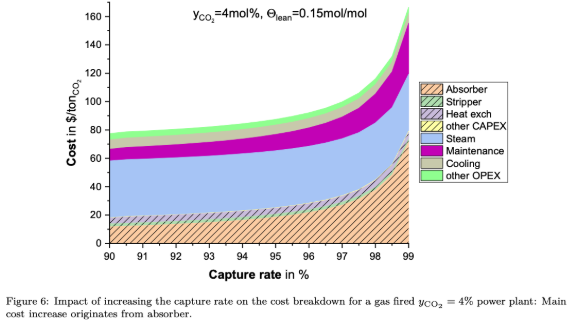
Retrofitting existing coal-fired power plants is expensive, technically challenging, and comes with a significant energy ‘penalty’, the extra energy required to power capture operations. Economic sustainability of post-combustion retrofits should be compared on a portfolio basis to CCS on new-build plants, where energy efficiency can be optimised and sequestration sites strategically selected (Hardisty et al., 2011).

CO2 currently lacks sufficient intrinsic market value to make projects economically viable without subsidies. Globally, carbon is largely treated as a waste product with limited commercial value or cascading uses (McLaughlin et al.,2023). National carbon pricing is often absent or insufficient, and public intervention is needed to treat carbon removal as a public good. Effective policies must combine strong government funding, financial incentives, and regulatory frameworks to drive innovation, scale-up, and cost reductions.

Promising developments are emerging in voluntary carbon markets. In 2022, these markets began differentiating by activity type, with carbon removal projects commanding the highest value (Ulucak et al., 2019). The average carbon credit price for carbon removal (~$20/tCO₂) was more than twice that for nature-based removal (~$10/tCO₂) and about four times that for renewable energy offsets (~$5/tCO₂) (McLaughlin et al.,2023).

Key findings: Scaling CCUS requires an integrated approach combining technology, policy, and finance. Countries with supportive regulatory frameworks and financial incentives, such as Norway, demonstrate higher feasibility and investor confidence. However, economic viability is constrained by high retrofitting costs, low CO₂ market value, and technological uncertainty. To achieve meaningful climate impact, governments must provide robust incentives, clear legal frameworks, and credible carbon pricing to enable CCUS projects to move beyond demonstration to large-scale deployment.

In this series:

  • Part 1: Climate Mitigation and the Price of CCUS

  • Part 2: Case Studies

  • Part 3: Malaysia’s Big Ambitions 

  • Part 4: Issues for Successful Deployments

Reach us at khorreports[at]gmail.com

CCUS Role in the Transition to Net-Zero: Part 3

Malaysia’s Big Ambitions

By Abigael Eminza and Claudia Nyon

Carbon Capture, Utilization, and Storage (CCUS) has advanced from pioneering offshore projects like Sleipner in Norway to massive new ventures such as Malaysia’s Kasawari development. Sleipner, which began injecting CO2 in 1996, proved that offshore saline aquifer storage was technically feasible, providing decades of operational experience and extensive monitoring data.

Building on this foundation, Malaysia is attempting to commercialize CCS at a scale never before attempted, with Kasawari’s offshore platform designed to process and inject 3.3 million tonnes of CO2 annually from gas with 40% CO2 content. The project is four to five times larger than Sleipner’s, signaling both ambition and unprecedented technical challenges. Together with other announced CCS hubs, Malaysia is positioning itself as a regional leader in carbon storage despite the absence of a dedicated regulatory framework.

The table below shows the differences between the Sleipner project in Norway and the Kasawari project in Malaysia.

IEEFA has compared Sleipner to Malaysia’s CCUS hubs, which are larger by factors of 10 or more. As IEEFA states, “Every proposed project needs to budget and equip itself for contingencies both during and long after operations have ceased” (IEEFA, 2023).

Against this backdrop, Petronas, Malaysia’s national oil and gas company, approved the Kasawari project in November 2022. The project aims to inject 3.3 mtpa of CO₂ underground to monetize a subsea gas deposit with an unusually high CO₂ content of 40%  (IEEFA, 2023).

Located in the South China Sea, 180 km north of Bintulu, Sarawak, the Kasawari CCS project draws gas from the SK316 block, which contains an exceptionally high 40% CO2 content. This concentration creates an unprecedented challenge: stripping out, transporting, and storing such a vast volume of CO₂.

To address this, Kasawari’s RM4.5 billion (US$1 billion) CCS component will include the world’s largest offshore CO2 processing platform. With a planned injection capacity of 3.3 mtpa, it will rank among the largest projects globally, second only to Chevron’s underperforming Gorgon project in Australia, at 3.5 to 4 mtpa.

The scale of Kasawari makes system integrity, injection well performance, and storage reliability absolutely critical if long-term CO2 reduction goals are to be achieved. Yet Malaysia has not established CCS regulations, leaving projects of this magnitude to advance without a dedicated regulatory framework.

This lack of precedent is not unique to Malaysia. Globally, governments and industry are proposing CCS storage sites with capacities far beyond those of Sleipner and Snøhvit. The reality is that projects of the scale envisioned for the Houston Ship Channel, the UK CCS clusters, Norway’s Northern Lights, or Malaysia’s Kasawari have never before been attempted.

In this context, Petronas has opted for a Sleipner-like model, performing all gas processing and CO2 recompression offshore on a dedicated platform. However, unlike Sleipner, Kasawari’s platform and equipment will be four to five times larger, making it the world’s biggest dedicated CO2 processing facility.

The unprecedented size and complexity of Kasawari also extend to its contracting strategy. To manage the project’s unique conditions, massive scale, and the risks, both known and unknown, associated with start-up and commissioning, Petronas has adopted an “alliance contracting” risk-sharing structure with Malaysia Marine and Heavy Engineering. While this conservative approach provides a safeguard against unforeseen challenges, it will likely add to the cost of what is already an RM4.5 billion (US$1 billion) component of the overall development.

Malaysia has recently been pivoting itself as being amenable to CCUS facilities being built in the country. 

By late 2024, four landmark CCUS projects have been announced:

  • Petronas Carigali Kasawari-M1: Located offshore Sarawak, the project is scheduled to begin operations in 2026. It is proposed that 60% of the storage capacity will be allocated to Malaysia, for PETRONAS and its partners, with the remaining 40% made available to other users (NS Energy, 2023; Havercroft et al., 2024). 

  • PTTEP’s Lang Lebah-Golok: Located offshore Sarawak, the project is scheduled for operation in 2028. Identified as Malaysia’s second CCS project, the Lang Lebah field holds an estimated 5 trillion cubic feet of gas in place. Development will require the removal of both CO2 and hydrogen sulphide (H2S) (Battersby, 2022).

  • BIGST Cluster: Estimated to hold around 4 trillion cubic feet of recoverable gas. The cluster has remained undeveloped, however, due to its high CO2 content. Given its strategic role in Peninsular Malaysia’s energy security, development will hinge on carbon capture and storage (CCS), positioning it as the first CCS project in the region (Searancke, 2024; Petronas, 2022).

  • M3 Project: Located offshore Sarawak, East Malaysia. The project is designed to store CO₂ emissions from multiple industries in Japan, including those in the Setouchi region, through injection into offshore Sarawak reservoirs (Battersby, 2024).

According to Malaysia’s National Energy Transition Roadmap (NETR), the following CCUS-related targets have been stated. 

By 2030: 

  • Develop 3 CCUS hubs (2 in Peninsular Malaysia, 1 in Sarawak) with a total storage capacity up to 15 mTpa (15 million tonnes per annum, mTpa), about 300,000 barrels per day (bpd).

By 2050: 

  • Develop 3 carbon capture hubs with a total storage capacity between 40 to 80 mTpa.

A CCUS bill was planned to be tabled by November 2024, and was pushed forward a few months later. Malaysia’s Carbon Capture, Utilisation and Storage (CCUS) Bill 2025 has cleared both houses of Parliament and now awaits Royal Assent, with supporting regulations slated to come into force by March 2025 (The Edge Malaysia, 2025; Malaymail, 2025). Championed by Economy Minister Rafizi Ramli, who has positioned himself as the government’s lead architect on industrial decarbonisation, the bill is designed to unlock investment, regulate offshore CO₂ storage, and lay the groundwork for a carbon tax in 2026. Rafizi has argued that Malaysia cannot rely on reforestation alone and must instead leverage its vast depleted reservoirs and offshore capacity to host large-scale CO₂ storage. By providing a legal framework and clear incentives, the bill seeks to position Malaysia as a regional hub for CCUS, attract foreign investment, and generate new revenue streams through state taxes, port fees, and industrial partnerships.

Petronas is pressing ahead with its decarbonisation strategy following the passage of Malaysia’s CCUS Bill 2025, with the flagship Kasawari CCS project now in production and preparing to capture and inject up to 3.3 million tonnes of CO2 annually into the M1 field offshore Sarawak (Lee, 2025). To deliver this, Petronas awarded a RM4.5 billion EPCIC contract to Malaysia Marine and Heavy Engineering (MMHE) in August 2025 for the construction of the world’s largest offshore CO2 processing platform, located about 138 km from shore (The Edge Malaysia, 2022). The platform will be central to Malaysia’s ambition to become a regional CCUS hub, offering storage services beyond domestic demand.

Key findings: Sleipner demonstrated the technical viability of offshore storage but also highlighted the uncertainties of long-term containment, lessons that are highly relevant for Malaysia’s next-generation projects. Kasawari’s scale makes it a global test case for whether CCS can manage very high CO₂ concentrations and sustain multi-million-tonne annual injections. Yet, regulatory gaps, cost escalation risks, and system integrity concerns cast uncertainty over its long-term effectiveness. Malaysia’s broader CCUS roadmap shows strong ambition, but success will hinge on robust oversight and the ability to manage risks at scales far beyond what has been proven to date.

Editor’s Note: After losing the Parti Keadilan Rakyat (PKR) deputy presidency to Nurul Izzah Anwar in May 2025, Rafizi submitted his resignation as Economy Minister, effective 17 June 2025. Prior to his departure, he had already completed major tasks like the 13th Malaysia Plan. He is considered to be the key mover of the Bill, making CCUS a high priority.

Worth noting: The debate over CCUS in Malaysia was marked by a division between government-backed initiatives and civil society opposition. The government views CCUS as a key part of its National Energy Transition Roadmap, aiming to position Malaysia as a regional lead in carbon management and kick-starting lots of capital expenditure. State-owned energy company Petronas actively pursues offshore CCS projects, collaborating with international partners like ADNOC and Storegga to enhance CO2 storage capacity (The Edge Malaysia, 2022). But, environmental organizations and opposition lawmakers express significant concerns. Groups such as Greenpeace Malaysia and Sahabat Alam Malaysia (SAM) argue that the CCUS Bill was hastily passed without adequate public consultation, questioning its environmental and social implications (Greenpeace Malaysia, 2025). Furthermore, the Borneo states of Sarawak and Sabah have pushed back on the federal CCUS Bill, seeking more control over CCS projects within their territories.

In this series:

  • Part 1: Climate Mitigation and the Price of CCUS

  • Part 2: Case Studies

  • Part 3: Malaysia’s Big Ambitions 

  • Part 4: Issues for Successful Deployments

Reach us at khorreports[at]gmail.com

CCUS Role in the Transition to Net-Zero: Part 2

Case Studies

By Claudia Nyon and Abigael Eminza

Carbon Capture, Utilization, and Storage (CCUS) has long been promoted as a critical technology for reducing emissions from fossil fuels while supporting energy security. Over the past three decades, several high-profile projects have attempted to demonstrate the feasibility of capturing CO2 at scale and storing it underground. Some, such as Petra Nova in Texas and Sleipner in the North Sea, have demonstrated that capture and storage can be effective under the right conditions, providing valuable data and technical proof of concept. Others, however, such as Kemper County, Gorgon, and Boundary Dam, have struggled with spiraling costs, underperformance, and technical failures. Taken together, these projects reveal both the promise and the fragility of CCUS as a climate solution.

Success stories

The Petra Nova project in the US

Designed to capture approximately 90% of carbon dioxide from a power plant and inject it into an oil field to boost crude oil production, the Petra Nova project was completed on time and within budget (Dubin, 2017). The system diverts about 37% of the coal power plant’s emissions through a flue gas slipstream, capturing roughly 33% of total emissions, and requires a dedicated natural gas unit to meet the energy-intensive demands of the carbon-capture process. Captured CO2 is then injected into nearby oil fields for enhanced oil recovery, a process that increases crude oil flow by injecting CO2, water, or chemicals into reservoirs.

Although the project shut down during COVID-19 due to low oil prices (Dilon & Anchondo, 2020), it has been operating since 2023 (Power Engineering, 2023) after being bought by JX Nippon in 2022. 

Sleipner, the world’s first commercial CCUS project.

The Sleipner project began CO2 injection in 1996 in response to Norway’s early-1990s carbon tax, which made carbon capture more profitable than just separating the carbon and releasing it into the atmosphere. This was particularly important because the gas contained about 9% CO2, above market specifications (Dickson, 2024). By 2016, Sleipner had reached its 20-year milestone, with 16 million tons of CO2 stored in the Utsira sandstone formation, located 800 meters beneath the seabed (Skalmeras, 2017).

Storing carbon underground is not an exact science, making Sleipner one of the most studied geological fields worldwide, with over 150 academic papers published (IEEFA, 2023). Their seismic datasets have been downloaded more than a thousand times. 

Despite the studies, long-term stability remains uncertain. In 1999, three years after Sleipner began storage, CO2 had already migrated from its injection point to the top of the formation and into a previously unidentified shallow layer. Large amounts accumulated there, and if the layer had not been sealed, the CO2 might have escaped (IEEFA, 2023). 

Rather than serving as models for CCS expansion, Sleipner and Snøhvit, another Norwegian project, raise doubts about whether sufficient capability, oversight, and sustained investment exist to keep CO2 securely stored beneath the sea permanently.

Failures 

The Kemper project

The Kemper project was initially designed to capture approximately 65% of the plant’s CO2 using pre-combustion technology. However, costs quickly spiraled out of control. Originally estimated at US$2.4 billion, the project had an excess of $7.5 billion (Dubin, 2017).

Repeated delays and cost overruns eventually forced the suspension of work (Swartz, 2021). While the project was intended to gasify lignite coal and capture the resulting CO2, its original purpose was undermined when the plant shifted to natural gas, leaving much of the carbon capture equipment idle and unused.

Gorgon, Australia

Once hailed as a global showcase for CCS, Chevron’s Gorgon project has struggled to meet expectations. Located at the company’s massive LNG facility on Barrow Island, Gorgon was designed to strip CO2 from natural gas and store it underground. Yet, Chevron reports that it has so far buried just over 10 million tonnes of CO2, barely a third of its original target (Mercer, 2024).

Technical problems, particularly with reservoir pressure, have limited injection rates and delayed progress toward sequestering the promised 80% of the plant’s emissions. Since commencing operations in 2019, performance has steadily declined: CO2 capture dropped from 34% in 2022–23 to just 30% in 2023–24, representing only a small fraction of the facility’s total emissions (Denis-Ryan & Morrison, 2024). To compensate, Chevron has been forced to implement costly technical fixes and purchase carbon offsets.

The difficulties at Gorgon reflect a broader pattern. Wang et al. (2021) observe that most CCUS projects over the past three decades have either struggled or failed to achieve their objectives. Larger plant sizes, in particular, increase the risk of underperformance, and existing support mechanisms have not been sufficient to overcome these challenges. Achieving gigaton-scale deployment will therefore require reducing risk, improving returns, and better aligning technology, policy, investment, and deployment.

Boundary Dam, Canada

Canada’s Boundary Dam 3 (BD3) coal plant in Saskatchewan offers another example. In March 2021, BD3 marked the capture of its four millionth metric ton of CO2, two years later than forecast, underscoring its failure to achieve the 90% capture rate originally promised (Energi Media, 2024). 

The retrofit cost more than CAD 1 billion, yet performance has consistently fallen short. Through 2023, the long-term capture rate averaged only 57%  (IEEFA 2021). The system operates roughly 80% of the time, and when running, it processes just 73% of the plant’s flue gases, leaving a substantial portion of CO2 uncollected.

The plant has rarely achieved its design capacity of 3,200 metric tons per day and has never sustained that level for any extended period. SaskPower has since scaled back its capture target to 65% of emissions. Moreover, a significant portion of the CO2 collected is used for enhanced oil recovery (EOR), which in turn results in additional emissions, thereby reducing the net climate benefit considerably smaller than initially claimed (IEEFA, 2024).

Technical failures have compounded these shortcomings. In 2021, the CCS facility captured 43% less CO2 than the previous year after a breakdown in the main compressor motor forced the system offline for several months (Anchondo, 2022). Although repairs have since been completed, the outage illustrates how dependent carbon capture is on complex, custom-built equipment and how downtime can dramatically reduce emissions removal.

Key findings: The successes show that CCS can be technically feasible, completed on time and within budget, and deliver useful insights into subsurface CO₂ behavior. Yet, the failures highlight recurring challenges: escalating costs, reliance on volatile oil markets, technical underperformance, and uncertain long-term storage integrity. These case studies suggest that CCUS will require stronger policy frameworks, more consistent oversight, and sustained investment to scale effectively. Without these supports, large-scale deployment risks repeating the mixed track record seen so far.

In this series:

  • Part 1: Climate Mitigation and the Price of CCUS.

  • Part 2: Case Studies

  • Part 3: Malaysia’s Big Ambitions

  • Part 4: Issues for Successful Deployments

Reach us at khorreports[at]gmail.com

CCUS Role in the Transition to Net-Zero: Part 1

Climate Mitigation and the Price of CCUS

By Claudia Nyon | Edited by Abigael Eminza

This four-part series explores the opportunities, issues, and costs of Carbon Capture, Utilisation and Storage (CCUS), and examines CCUS, with a particular focus on Malaysia’s newly enacted CCUS Act 2025 (Malaymail, 2025).

CCUS has emerged as one of the most debated tools in the global decarbonisation toolkit, straddling the line between necessity and controversy. Initially rooted in the 1920s with natural gas purification and expanded in the 1970s through enhanced oil recovery (EOR), CCUS has since evolved into a proposed solution for hard-to-abate sectors, such as cement and steel. Its relevance has grown in the wake of the Paris Agreement, with more than 30 major projects announced globally since 2020 and countries like Malaysia enacting dedicated legislation such as the CCUS Act 2025 to spur adoption. Yet, despite decades of technical deployment, CCUS costs have remained stubbornly high and resistant to the steep declines seen in renewables, raising questions about scalability and economic efficiency. This introduction sets the stage for examining CCUS’s history, economics, policy drivers, and its contested role in achieving net-zero.

What is CCUS?

Carbon Capture and Storage (CCS) involves capturing carbon dioxide from large point sources, such as power plants, and securely storing it underground to prevent its release into the atmosphere. Carbon Capture, Utilisation, and Storage (CCUS) extends this concept by repurposing captured CO2 for industrial applications. 

History of Carbon Capture and Its Utilisation in Enhanced Oil Recovery

  • 1920s: Early carbon capture emerged with natural gas purification, which required separating carbon dioxide from gas streams.

  • 1970s: Captured CO2 began being injected into oil fields for Enhanced Oil Recovery (EOR), a practice that continues to this day.

  • Today: CCUS remains widely used in EOR to unlock trapped oil reserves, demonstrating one of the earliest and most sustained applications of carbon capture technology.

The practice of capturing carbon dioxide from gas streams traces back to fossil fuel extraction. While oil and natural gas often occur together in the same reservoir, early fossil fuel development largely overlooked natural gas due to the lack of adequate pipeline infrastructure (Energy Information Administration Office of Oil and Gas, 2006). 

By the early 1920s, with improvements in pipeline technology, the demand for natural gas increased, prompting the development of techniques to remove carbon dioxide, known as ‘purification’.

The first commercial CO2 capture and injection for EOR began in Texas in the 1970s (Cherepovitsyn, 2020). EOR remains the largest application of CCUS, as primary/secondary recovery leaves ~⅔ of oil untouched, thereby necessitating the injection of carbon into declining oil fields to unlock trapped reserves (National Energy Technology Laboratory).

Approximately 73% of the carbon successfully captured annually in the United States is utilized for EOR to unlock additional fossil fuel reserves (IEEFA, 2022).

Petronas has implemented EOR techniques to extract fossil fuels in Malaysia (New Straits Times, 2014). 

CCUS and EOR: Statistics of Use

CCUS in Global Climate Change Mitigation

CCUS currently occupies a complex but increasingly central role in carbon policy and carbon economics. 

The Paris Agreement of 2015 set ambitious emissions reduction targets, and the pathway to net-zero emissions by mid-century remains highly debated. This means the world must reduce today’s 50 Gt of total annual CO2-equivalent emissions to around net-zero by mid-century, with reductions of around 40% achieved by 2030 (Energy Transitions Commission, 2022). 

On the back of this, CCUS has positioned itself as a solution to decarbonise industries where alternatives are limited, such as the cement industry that produces 7% of global industrial greenhouse gas emissions (GHGs) (IEA, 2023), and to deliver carbon removals over the next few decades. 

  • 30+ commercial CCUS projects announced globally since 2020 (~$27 billion in near-final investments) (IEA, 2020).

  • Malaysia’s National Energy Transition Roadmap (NETR) projects CCUS mitigating 5% of energy-sector emissions by 2050 (NETR, 2023). (See Part 2 onwards for more)

The Price of CCUS

The Elusive Cost of Carbon Avoidance 

One of the most persistent challenges in evaluating CCUS is the lack of a single, definitive cost estimate for preventing one metric ton of CO2 from entering the atmosphere, a metric known as the "avoidance cost."

The cost of capture ranges from:

Early-stage feasibility studies, which often form the basis of projections, tend to underestimate actual expenses by 15% to 30%, according to the OECD (2011), and as also shown in Table 1 at AACE (2005). These estimates can swing even wider when accounting for site-specific variables like infrastructure needs, regulatory hurdles, and regional labor costs. 

For example, a Norwegian study found that adapting CCUS to an existing gas plant required 30% additional spending due to factors like specialized cooling systems and safety upgrades (OECD, 2011). This variability makes it difficult to compare technologies or assume cost advantages for one capture method over another.

The Trade-Off between Capture Rates and Costs

To meet net-zero targets, the CO2 capture rate should be as high as economically viable and as close to 100% as technologically possible. However, modifications in the capture plant design and operations to achieve a 100% capture rate would lead to increased costs. 

To demonstrate, the flue gas from a gas-fired power plant contains approximately 4 mol% CO2. After capturing 99% of the CO2, the resulting CO2 composition is 400 ppm, which is lower than current atmospheric CO2 concentrations. The CO2 separation at the top of the absorber becomes as challenging as direct air capture (Brandl et al, 2021).

For gas-fired power plants, increasing the capture rate from 90% to 96% incurs an additional cost penalty of about 12%, taking the total cost from ~$80 to $90/tCO2. Increasing it to 99% could increase costs to $160/tCO2 (Brandl et al, 2021; Energy Transitions Commission, 2022). 

Most projects, therefore, target a 90 percent capture rate as a pragmatic balance between performance and affordability. Yet even this benchmark is often missed as real-world examples fall short of achieving a high capture rate (>90%) due to cost-minimising decisions, engineering setbacks, or the early-stage nature of technological deployment (to be explored later in this series). 

CCUS costs increase sharply as capture rates approach 100%. Below are the capture rates and costs in a gas-fired power plant

Stagnant Costs and Missed Learning Curves 

Unlike renewable energy technologies, which have seen dramatic cost reductions over decades, CCUS has defied expectations of similar progress.

A 2023 analysis noted that cost estimates for fossil power plants with CCUS have remained flat for over 40 years, suggesting a lack of systemic learning across the industry, from carbon capture to burial, despite decades of using all elements of the chain (Bacilieri et al., 2023).

Figure 1, below, shows estimates of the cost of fossil power with CCUS observed in the academic literature and industry reports over the last 40 years. Many of these reports stated that costs were expected to decline in the future due to technological learning. However, the plot makes clear that these expectations have so far not been realised. In fact, quite the opposite – as further information about the technology has been gained, cost estimates have generally risen (Bacilieri et al, 2023).

This stagnation is striking given that components like CO2 pipelines and injection wells have been used commercially since the 1970s. By contrast, technologies like solar panels and batteries typically reduce costs by 10 percent for every cumulative doubling of production capacity, a pattern CCUS has failed to replicate (Congressional Budget Office, 2023).

The High Price of Over-Reliance on CCUS

The high costs of CCUS have spurred debate about its optimal role in decarbonization. Recent modeling indicates that net-zero pathways relying heavily on CCUS could require $30 trillion more in spending than those prioritizing renewables and energy efficiency (Bacilieri et al., 2023). 

This divergence arises because large-scale CCUS deployment delays the cost declines typically seen in alternatives like wind, solar, and green hydrogen. However, abandoning CCUS entirely isn’t economically viable either: certain industries, such as cement and steel, lack ready substitutes for fossil fuels, making limited CCUS deployment a cost-effective compromise (IPCC, 2023).

Net CO2 emissions over time for our low- (blue dashed lines), medium- (yellow dash-dotted lines), and high-CCUS (red dotted lines) scenarios, and all the other C1 and C2 scenarios (grey solid lines). The black dotted line marks the year 2060, which is the latest year we require selected scenarios to reach net zero. The green band and the vertical black solid and dashed line highlight the corridor of ±10% of today’s CO2 emissions, which we require our scenarios to fall into in 2050. 

Foreseeable Economic and Policy Challenges

The divergence between high and low CCUS decarbonization pathways reveals a fundamental tension: economies prioritizing rapid scaling of renewables, electrolyzers, and energy storage achieve faster cost reductions through technological learning and economies of scale (Greig & Uden, 2021). 

This dynamic creates a self-reinforcing cycle; accelerated deployment of alternatives further lowers their costs, reducing reliance on CCUS. By contrast, high-CCUS pathways face compounding expenses, as delayed investment in renewables perpetuates dependence on a technology with stubbornly stagnant costs.

Yet dismissing CCUS entirely ignores structural realities. Even critics acknowledge its inevitability for hard-to-abate sectors like cement (see Hughes, 2017), though its role remains hotly contested. Some fear that the technology now confronts a critical juncture, the so-called "valley of death" where technical viability clashes with insufficient private investment (Reiner, 2016). Market forces alone appear inadequate: CCUS ranks among the costliest near-term mitigation options (IPCC, 2022), with most projects requiring government backing to pencil out financially (Rempel et al., 2023). This dependency is exacerbated by the fossil fuel industry’s tepid commitment; oil and gas firms allocated less than 1% of 2020 capital expenditures to clean energy (World Energy Investment, 2021), raising questions about their willingness to drive meaningful CCUS scale-up without policy mandates.

Key findings: CCUS is neither a silver bullet nor universally accepted, but it’s unavoidable for net-zero, particularly in hard-to-abate industries. The debate now centers on how much CCUS is optimal, balancing cost, scalability, and emissions goals.

In this series:

  • Part 1: Climate Mitigation and the Price of CCUS

  • Part 2: Case Studies

  • Part 3: Malaysia’s Big Ambitions

  • Part 4: Issues for Successful Deployments

Reach us at khorreports[at]gmail.com

Social media scan on palm oil @ 16 Oct 2024

Here’s a scan of some news and issues that have caught the attention of palm oil watchers, in the last three weeks! We mostly pick up on things on Twitter/X. Come here for more, https://x.com/khorreports

EUDR. A hot topic amongst regulators and market players, we have argued it would be a two year muddle-through. Maybe for three years, with the one year additional time? Alerts on X (1) and (2). There is positive feedback about enhanced regulations and traceability in the palm and rubber industries, including in Ivory Coast, Malaysia, and Thailand. The regulatory upgrades are being underestimated, while costs may be overestimated. Aida Greenbury praises how cocoa farmers in Ghana are preparing for the EU's Deforestation-Free Due Diligence regulations.

On prices and trade. Susan Stroud is a notable expert on soy from North America. A 25-year palm oil price chart from Malaysia's BMD is mentioned, and Indian buyers are canceling palm oil shipments due to a sharp duty hike and rising Malaysian prices. Alerts on X (1), (2), (3).

Malaysia’s palm oil consumption has dropped significantly. Diesel consumption in Malaysia is down due to subsidy reforms, but oleochemical exports may gain from Indonesia's export duty adjustments.

News on Indonesia. New data shows an increase in palm oil deforestation in Indonesia in 2022, with no data yet for 2023. The government's Food Estates program faced challenges, particularly in peat areas, due to difficult terrain and market issues. Indonesia's Food Estates project raises concerns about food inflation, with climate change, a weak rupiah, and high imported food prices posing potential risks.

News from India. India's palm oil yields are around 12 tonnes/hectare, lower than major producers like Malaysia and Indonesia. India's vegetable oil imports dropped 30% in September due to lower demand and high prices, following higher imports in July-August. 

Palm oil is used in the energy sector and in renewables. Gas oil and Brent crude are key factors for palm oil market watchers. An oil asset map from @SPGCI provides detailed insights into the Middle East. Energy, beyond food and personal care, is crucial for the palm oil sector. The rapid growth of renewables is important. By 2030, solar PV and wind are expected to double their share to 30% of the global power mix, meeting around half of global electricity demand. (Palm oil biomass should count in the dark green “other renewables” segment.) But there’s always a risk of being called out on greenwashing… The UK advertising watchdog ruled Virgin Atlantic’s “100% sustainable aviation fuel” ad misleading and instructed them to clarify the environmental impact in future ads (note: SAF is a technical term and it still contains fossil fuels). 

Green Hydrogen: Part 3 - Barriers in Green Hydrogen Production & the Malaysian Perspective

In case you missed the previous article, we looked into the driving factors of green hydrogen and why various stakeholders are enthusiastic about its role in expediting a climate neutral economy. However, green hydrogen is not without its shortcomings.

Let’s dive into the drawbacks associated with the production and utilization of green hydrogen (as with the previous article, this is a non-exhaustive list).

What is standing in our way of a green hydrogen future?

1. High production costs and sustainability concerns. Previously, we discussed the decreasing costs of green hydrogen production. However, are they truly competitive and wholly sustainable? 

As of 2021, it was reported that green hydrogen cost approximately USD5 per kilogram, whereas grey hydrogen amounted to USD1.50/kg (S&P Global, 2021). This vast difference has deterred many companies and industry players from investing in green hydrogen technology. Many choose to adopt blue hydrogen instead. Before the Russia-Ukraine war, S&P Global reported that blue hydrogen cost between USD1.69/kg and USD2.55/kg.

When considering the production costs of green hydrogen, the capital expenditure (CAPEX) must be taken into account. Substantial investments and subsidies are required for electrolysers and the relevant technologies to improve and maintain their efficiency. 

At present, Proton Exchange Membrane (PEM) electrolysers are the most viable option as they are flexible, efficient and tend to have a smaller carbon footprint (IRENA, 2018). These electrolysers can be connected to a grid or an off-grid variable renewable energy (VRE) plant. If it is connected to a grid, the load factor is greater and as a result, the investment costs are spread across larger units of hydrogen. However, despite the lower costs, IRENA observed that hydrogen produced from grid-connected electrolysers (that utilize fossil fuels) will not be completely renewable. 

If electrolysers are connected to off-grid, VRE plants, the load factor decreases as it would depend upon the availability of renewable energy sources (ie: sunlight and wind). As a result, investment costs are spread across fewer units of hydrogen. The upside of this is that hydrogen produced will be completely renewable, green hydrogen (IRENA, 2018). 

Additionally, the cost of producing renewable energy is still relatively high in comparison to its alternatives, thus driving up the levelized cost of electricity (LCOE)* from VRE plants. As such, the ideal equation for green hydrogen production is a combination of low LCOE and a high capacity factor. 

*LCOE is an economic metric used to compare the lifetime costs of generating electricity across various generation technologies (S. Raikar & S. Adamson, 2020).

Spolight: The US Context

In the United States, the Inflation Reduction Act (IRA) introduced a 45V Hydrogen Production Tax Credit, which awards up to USD3 per kg of hydrogen produced to projects with a lifecycle greenhouse gas emissions intensity of less than 0.45kg per kilogram of hydrogen (kg CO2e/kg H2) (CSIS, 2023). The US Treasury Department is currently working out how emissions will be calculated. 

A critical factor under review is the extent to which grid power can be used to run electrolysers when renewable energy sources are unavailable (Hydrogen Insight, 2023). Developers argue that the use of grid power will allow around-the-clock operations, yielding lower hydrogen costs. The use of this electricity will be later compensated by sending renewable energy back to the network when there is excess supply. However, Hydrogen Insight has reported that a coalition of scientists, environmental campaigners and energy companies are against this suggestion as it could double net emissions when compared to grey hydrogen.

The coalition is calling for the Treasury Department to introduce hourly matching and additionality, requiring plants to prove that electrolysers have sourced their electricity from a qualified renewables facility. Analysts and developers argue that hourly-matching would significantly increase costs as operations of electrolysers are limited to the availability of renewable energy sources. 

They are instead encouraging the Treasury Department to adopt annual-matching as operations of electrolysers would not depend solely on renewable energy sources. In Arizona, electrolyser plants that operate in this manner require grid electricity 19-35% of the time. It was found that these plants do in fact lead to greater emissions from the Arizona grid (Hydrogen Insight, 2023). It appears that a middle ground has to be met between the economies of green hydrogen and a truly sustainable yield from production. 

*To learn more about the 45V Hydrogen Production Tax Credit, check out this podcast episode by The Hydrogen Podcast*


2. Water worries. Where’s the water coming from? This is a central, but lesser discussed, issue surrounding the production of green hydrogen. It has been estimated that green hydrogen production will reach 530 Mt/year by 2050 (COAG Energy Council, 2019). This would require approximately 7950 GL of water, taking into account demineralization and water cooling requirements for electrolysis (Woods et. al., 2022). This amount will gradually increase as the green hydrogen economy fully matures.

Although water needs for agricultural and industrial sectors are much greater, the amount of water required for the production of green hydrogen is nevertheless a cause for concern. Water scarcity is already a problem across regions, especially due to extended droughts, decreased rainfall and other related impacts of climate change.

As such, relevant stakeholders must develop new frameworks and strategies to ensure security and sustainability within the energy-water nexus.

At present, there are a few sources of water in the production of green hydrogen - freshwater, seawater, brackish water and wastewater. The utilization of freshwater has the lowest treatment costs but it is not the preferred option as it diverts water away from more important economic sectors (GHD, 2021). Desalination plants for seawater or brackish water are also not a viable solution to the water issue for green hydrogen production. A large-scale desalination plant would require increased investments, but it would still not yield a sufficient quantity of water to produce 530 Mt of green hydrogen by 2050 (it is estimated that only 0.4% of water required can be sourced from desalination plants) (COAG Energy Council, 2019).

Use of desalination plants for green hydrogen production could also interfere with initial objectives of improving overall water resilience in the region. For instance, in Western and Southern Australia, desalination plants are increasingly used as a source for drinking water (Woods et. al., 2022). Additionally, overall costs would increase as treatment measures would be required to mitigate the environmental impacts of desalination (e.g. brine management) (Panagopoulos et. al., 2019). The use of seawater would also increase water extraction up to 5 times, adversely affecting ocean diversity (E. Jones, 2019). Due to these many disadvantages, we can safely conclude that desalination plants are not the optimal solution to water worries surrounding green hydrogen production.

It has been argued that utilizing tertiary effluents from wastewater may be the best alternative source. Producing hydrogen from these recycled effluents would prevent wastage and ensure climate independency. In Australia, 1720 GL of tertiary effluents are returned to the environment each year. Utilizing this water would yield a yearly production of 0.1 Gt of green hydrogen, with none of the additional costs that come with desalination plants (Woods et. al., 2022).

3. Infrastructure Deficiencies. Over the years, as green hydrogen production expands to meet growing demand, the limitations posed by infrastructural deficiencies have become evident. Storage and transportation facilities are the main barriers in the transmission of green hydrogen. Let’s first take a look at the issues surrounding transportation.

Hydrogen is mostly transported through pipelines, much the same as natural gas. Ships are used for longer distances. At present, about 2,600km of hydrogen pipelines are operating in the United States and approximately 2,000km in Europe (IEA, 2022). This is extremely limiting when compared to the 1.2 million km of natural gas pipelines installed worldwide. You’re probably wondering - why not just use the existing natural gas pipelines to transport hydrogen? It is unfortunately not that simple. 

Hydrogen’s chemical makeup is different to that of natural gas’. Its density and boiling points are much lower. For instance, hydrogen has a boiling point of -253 degrees Celsius (°C), compared with -162 °C for natural gas (IEA, 2022). Due to these difficulties, hydrogen is usually produced close to industrial areas, where it is most used. 

It is possible to reconfigure and repurpose natural gas pipelines to suit hydrogen transportation but this will require significant readaptation and more research into the technical challenges that may arise, especially for offshore pipelines. At present, there is very limited practical experience in repurposing natural gas pipelines for hydrogen transportation. Thus far, only the Netherlands has successfully reconfigured the 12-km Yara-Dow pipeline in the south (ReThink Research, 2022).

However, with more research and advancements, the adaptation of pipelines would be much more expedient and cost-effective than constructing new hydrogen networks (IEA, 2022).

Transportation by ship for longer distances requires hydrogen to be converted to ammonia or liquified hydrogen (X. Li et. al, 2023). While the technologies for liquefaction are readily available, it is an energy intensive process. These plants have an average electricity consumption of approximately 10 kilowatts per kg, which is approximately 30% of the hydrogen energy content (IEA, 2022). This is a significant loss and would result in increased costs. There is also the question of whether these plants will be powered by renewable energy. 

Ammonia storage and transportation is readily available, with meticulous safety measures in place. However, the conversion of ammonia back to hydrogen, also known as ammonia cracking, involves energy losses of up to 30% and rarely includes hydrogen purification (IEA, 2022).

Source: IEA, 2022

Difficulties with storage also act as hindrances to the commercialization of green hydrogen. Facilities for storage are needed to meet fluctuations in supply and to maintain energy security in the event of disruptions (IEA, 2022). 

Natural gas storage can also be repurposed for hydrogen use. Salt caverns, aquifers and depleted natural gas fields are among the types of storage facilities which can be used for green hydrogen. For instance, hydrogen is stored in salt caverns along the Gulf Coast in Texas (Journal of Petroleum Technology, 2023). However, the announcement of these storage projects have been slow and they would require considerable lead times to be ready for use due to limited technological advancements and practical experience (IEA, 2022).

The next issue to consider vis-à-vis transportation and storage is safety. 

When you mention hydrogen, the first thing that most people think of is the Hindenburg. The iconic airship, containing approximately 7 million cubic feet of hydrogen, burst into flames in May 1937. This disaster has been a precautionary tale against the use of hydrogen as a renewable energy carrier. 

While it was landing, the Hindenburg burst into flames in Lakehurst, New Jersey (Smithsonian via NASM Archives).

Due to its high diffusivity and low viscosity, hydrogen leakage is a real and probable issue. It also has low minimum ignition energy, wide flammable range, wide explosion range and embrittlement effects (Green, 2006). In the course of its storage and transport, spontaneous combustion as a result of leakages could cause jet fire or explosion accidents (H. Li, 2022). In 2019, the explosion of a hydrogen fuel storage tank in South Korea caused two deaths and six injuries (Yang et al., 2021). Experts argue that more research needs to be conducted to ensure safety mechanisms when transporting and storing hydrogen, especially in repurposed natural gas pipelines (IEA, 2022). 


The list of issues preventing the uptake of green hydrogen projects seem somewhat endless but with further research, investments and national policies in place to reach net-zero emissions, the commercialization of green hydrogen is most definitely an achievable feat. 

In fact, we’re seeing a growing interest in green hydrogen right here in Malaysia.


The Malaysian Perspective

As a signatory of the Paris Agreement, Malaysia has committed to reducing GHG emissions by 45% by 2030 (MIDA, 2021). This is an ambitious goal, but one that is definitely achievable if we enhance efforts to transition away from a fossil fuel-intensive economy. 

Although stakeholders are focussing mainly on renewable electricity as an alternative source of energy, green hydrogen will also play a part in achieving these climate goals. Hydrogen sourced from renewable energy is expected to comprise up to 5% of total final consumption by 2050. It will facilitate the decarbonisation of some industrial sub-sectors and meet growing export demands (IRENA, 2023).

IRENA estimates that demand for green hydrogen in Malaysia could reach 25 petajoules (PJ) by 2030, then further increase to 213 PJ by 2050. 55% of demand would be for ammonia and methanol production, while the remainder would be fed to domestic industries (such as transportation) and export to countries such as Japan and South Korea. 

As indicated in the National Energy Policy, the Malaysian government is currently working on a roadmap for the hydrogen economy (NEP, 2022). Deputy Minister of International Trade and Industry (Miti) Liew Chin Tong has stated that once the roadmap is implemented, his ministry will collaborate with relevant stakeholders to execute incentives and opportunities to boost investments in the green hydrogen economy (The Edge, 2023).

However, domestic energy companies and distributors such as Petroliam Nasional Berhad (PETRONAS), Sarawak Energy, SEDC Energy, amongst others, have already begun investments and developments. 

Sarawak, with its immense renewable energy resources (hydropower and mini hydro) is set to begin large-scale commercial production of hydrogen, with the aim of export by 2027. In September 2022, a Memorandum of Understanding (MOU) was signed between Sarawak Energy, SEDC Energy and South Korean companies Samsung Engineering, Lotte Chemical and Posco Holdings to research renewable hydropower supply for the state's green hydrogen and ammonia project (Project H2biscus) (The Star, 2022).

As part of this MOU, the companies will develop Malaysia’s first hydrogen plant at the Sarawak Petrochemical Hub in Bintulu. It will produce 630,000 tonnes of green ammonia, 600,000 tonnes of blue ammonia and 220,000 tonnes of green hydrogen each year (The Star, 2022). Premier Datuk Patinggi Abang Johari Tun Openg revealed that 7,000 tonnes will be channeled for domestic use and the remainder exported to South Korea.

The East Malaysian state is also in the midst of developing a state-of-the-art Automated Rapid Transit (ART) powered by hydrogen fuel cells. It is predicted to facilitate a 15% reduction of Sarawak’s carbon footprint (The Borneo Post, 2022). 

Through a collaboration with Universiti Kebangsaan Malaysia (UKM), PETRONAS has successfully increased the efficiency of their PEM electrolysers for green hydrogen production. These electrolysers are able to produce highly affordable green hydrogen at a cost of less than USD4/kg from market rate of USD5-6/kg - a game changer in the production of cost competitive green hydrogen (PETRONAS, 2022). In its recent Energy Transition Strategy, PETRONAS detailed its objective of pursuing up to 1.2 MTPA of hydrogen by 2030 - however, the methods of hydrogen production were not specified.

The goal of transforming Sarawak into a green energy hub does, however, raises concerns.The sourcing of electricity for green hydrogen from new hydropower dams would bring into question environmental issues, such as biodiversity loss, and the displacement of indigenous communities.

The Bakun Hydroelectric Plant (Sarawak Energy, 2021)

As such, Sarawak’s green hydrogen push should ideally only source hydropower from existing large scale infrastructure which would also secure a competitive advantage over production costs. infrastructure (e.g. the Bakun dam). But experts have expressed apprehension, citing Sarawak’s inability to cope with this influx of energy-hungry projects without enhanced hydropower generation.


Khor Yu Leng (principal of Segi Enam Advisors) summed up her findings on green hydrogen from the recent ASEAN Green Hydrogen Conference. She concluded that specialists are advocating for grey hydrogen with carbon credits due to logistical costs, concerns over water sources and raw material considerations associated with green hydrogen production. This renewable energy carrier will only be able to replace grey hydrogen once costs become more tenable and policy support is enhanced via subsidies. 

To conclude, it is evident that a green hydrogen economy is most definitely a potential pathway to preventing irreversible climate disasters and achieving net-zero emissions by decarbonizing hard-to-abate sectors.

However, as observed, this pathway is heavily dependent upon the expansion of renewable energy sources, costs of technologies and policy implementations by governments. 

We hope this series has given you an insight into the green hydrogen economy and its potential as an alternative renewable energy carrier.

Till next time!


This is the third and final article of a three-part series on the topic of green hydrogen as an alternative source of energy by Khor Reports.

By Nithiyah TAMILWANAN, Segi Enam Intern, 28 June 2023 | LinkedIn

Green Hydrogen: Part 2 - Key Reasons for the Surge in Green Hydrogen Demand

Following our first article on hydrogen and its potential as a renewable energy carrier, we’ll now venture into a common curiosity - what has pushed the recent launches of green hydrogen projects?

The list below is not exhaustive and there are a plethora of reasons (which could possibly take up a series on their own!) why green hydrogen has been pegged as the ‘energy carrier of the future.’ But let’s take a look at the main factors driving this wave:

1. Declining costs of renewable electricity: The cost of green hydrogen is greatly influenced by the cost of electricity procured from solar photovoltaics (PV) and onshore wind plants. As observed in the diagram below, the global weighted levelized cost of electricity (LCOE) produced by solar PV and wind plants have significantly decreased in recent years. This has resulted in launches of green hydrogen projects around the world.

 Change in global weighted levelized cost of electricity by technology, 2020-2021 (IRENA, 2021).

Since the pandemic, costs of raw materials and freight have been on the rise, however, this has not negatively impacted the competitiveness of renewables (IEA, 2022). Governments and large energy consumers have been intent on reducing dependency on imported gas due to supply chain disruptions and soaring prices caused by lockdowns and the Russia-Ukraine War. 

Installation of renewables has been the focus, particularly in Europe and North America (S&P Global, 2023). S&P Global reported that between 2021 and 2030, Europe and North America will install 2,000 square miles of solar panel, which is approximately the area of Los Angeles. This will further decrease the cost of renewable electricity in these countries. 

Furthermore, with regards to the manufacturing of equipment for solar and batteries, various policies have been introduced in Europe and North America to circumvent China’s dominance over the industry. 

2. Technologies scaling up: Expansion, expansion, expansion - the key to achieving economies of scale in green hydrogen production. 

Electrolysers are central to hydrogen supply chains and their deployment will decide the potential capacity of renewable energy and thus, the future of green hydrogen (Odenweller, A et. al., 2022). It has been reported that the capital cost of electrolysis has declined by 60% since 2010, resulting in a decreased cost of green hydrogen from USD10-15/kg to USD4-6kg (Hydrogen Council, 2020). 

The average unit size of these electrolysers has increased from 0.1 MWe in 2000–09 to 1.0 MWe in 2015–19. This indicates a transition from small demonstration projects to commercialized applications (IEA, 2019). A move necessary to reach economies of scale and ensure cost-competitiveness of green hydrogen.

The IEA reported that electrolysis deployment reached a new high in 2021, with 200 megawatts of additional installed capacity, three-times more than the previous year (IEA, 2022). Due to the energy crisis, there has been an unprecedented surge of projects with the aim of enhancing electrolysis capacity. However, it is worth noting that a large majority of these pledges and announcements have yet to be backed by final investment decisions (Odenweller, A et. al., 2022).

3. Wide array of existing and potential application: At present, hydrogen is predominantly used for the production of ammonia and in oil refining. It is applied at a smaller scale in the production of iron and steel, glass, electronics, specialty chemicals and bulk chemicals (IRENA, 2018). IRENA has segmented the applications of hydrogen to four industry categories: 

IRENA based on FCH JU (2016)

As observed in recent years, hydrogen use has been making inroads into hard-to-abate sectors where it had been mostly absent. These include transportation, buildings and power generation (X. Li et. al., 2023). In fact, hydrogen buses are already at their infancy stages around the world. In Europe, a hydrogen bus consortium has been established, with a goal of deploying 1,000 commercially competitive buses powered by green hydrogen, with the first 200 scheduled for use by this year (World Energy, 2020). In Kuching, three hydrogen-powered buses have begun trial operations, with plans to utilize them for public transportation and as feeder buses for the upcoming autonomous rapid transport (ART) system (Malay Mail, 2022). 

Green hydrogen has the potential of channeling considerable amounts of renewable electricity to these hard-to-abate sectors. It is highly advantageous as it can be stored in large amounts, thus ensuring it can cope with swings in demand as well as allowing for inter-seasonal storage, where demand could peak (IRENA, 2018).

Manufacturers of heavy-duty vehicles are also increasingly considering replacing lithium ion batteries with hydrogen as the latter can store more energy in smaller spaces and at lower weight (McWilliams & Zachmann, 2021).

4. Prospects for net-zero emissions: More than 120 countries have announced net-zero emission goals, with some including this target in legislations and policy documents (ECIU, 2023). We’re already on the precipice of surpassing 1.5℃ - so it is pertinent that this goal is at the forefront of all economic and industrial agendas. Fortunately, countries across continents share this sentiment, and many of them are adopting a green hydrogen pathway. However, industry players and experts are still questioning the viability of these pathways, emphasizing the need for heavy investments and subsidies.

Selected countries and blocs with a green hydrogen plan  

The European Union’s hydrogen strategy, published in July 2020, sets out a vision for decarbonising various sectors through clean hydrogen (European Commission, 2020). In line with the REPowerEU Plan, the EU aims to produce 10 million tonnes of renewable hydrogen by 2030 and to import 10 million tonnes by 2030 (European Commission, 2022). The strategy is centered on scaling up electrolysis production with renewable electricity. 

The European Commission understands the behemoth task ahead of them - their plan to produce 10 Mt of green hydrogen would require 80 to 100 GW of electrolyser output capacity and roughly 150 to 210 GW of additional renewable electricity capacity (Reuters, 2023).

The EU intends on exporting hydrogen through pipelines in the UK and France, and by sea using tankers. It also plans on the increasing hydrogen storage capacity of salt caverns in the UK, Central Europe and Spain (V.A. Panchenko et al., 2023). 

The implications of Brexit on the application of the Commission’s policies in the UK are still unclear. However, it is expected that the UK will not deviate too much due to shared infrastructure (such as gas pipelines) and trade with EU counterparts (Machado et al., 2022).

Over in Asia, China has established the Hydrogen Industry Medium and Long-Term Development Plan (2021–2035), focusing on green hydrogen production. With demand of more than 33Mt/yr, China is the largest hydrogen producer and consumer in the world (RMI, 2022). However, at present, most of China’s hydrogen supply is produced from fossil fuels, resulting in coal-based hydrogen costing about half as much as green hydrogen (CSIS, 2022). This cost factor has curbed the production of the latter.

Nevertheless, this status quo is quickly shifting due to China’s renewable power capacity. Currently, the largest in the world, the East Asian nation plans on doubling its solar and wind generation capacity from approximately 600 GW to 1,200 GW by 2030 (CSIS, 2022). As such, the Hydrogen Council predicts that electrolysis will become the most affordable low-carbon production technology in China (Hydrogen Council, 2021). The country’s short-term goal is to reach a 100GW green hydrogen deployment target by 2030, by focusing utilization in the chemicals, steel and heavy-duty transportation sectors (RMI, 2022).

Chinese state-owned oil giant Sinopec is in the midst of constructing the world’s largest green hydrogen facility in Kuqa, Xinjiang, with commercial operations set to begin by June 30th (Hydrogen Insight, 2023). Green hydrogen produced at this facility will be channeled via pipelines to a nearby oil refinery where it will replace the existing use of grey hydrogen.

However, questions have been raised regarding the extent of renewable energy supplied to the facility. It has been said that only 58% of the electricity needed will be sourced from a solar farm, with the rest supplied from a coal-reliant grid (Hydrogen Insight, 2023). This may negate the effectiveness of the Kuqa facility in reducing carbon emissions. 

The start of construction at the Kuqa green hydrogen project in December 2021 (Sinopec via Hydrogen Insight).

In 2019, Australia published its National Hydrogen strategy, with the aim of creating a clean, innovative, safe and competitive hydrogen industry that will be a major global player by 2030 (COAG Energy Council, 2019). The strategy focuses on removing market barriers, building supply and demand, and accelerating global cost-competitiveness. A key feature of this strategy is the establishment of hydrogen hubs which will promote economies of scale, innovation and cost-effective developments. 

In addition to production for domestic use, the strategy also places emphasis on exporting hydrogen, with the aim of becoming among the top 3 exporters of hydrogen to Asian markets by 2030. The strategy is currently under review to take into account recent global developments, in light of the US’ Inflation Reduction Act (IRA) (S&P Global, 2023). 

Although a large share of Australian hydrogen production is sourced from natural gas, the country has shifted its focus to green hydrogen in recent years. This is largely due to Australia’s vast potential in harnessing solar and wind energy, especially along its southern and western coastlines (COAG Energy Council, 2019). The shift to green hydrogen is exemplified in Australia’s 2023-2024 Federal Budget, where it introduced Hydrogen Headstart, an AUD2 billion initiative to underwrite the biggest green hydrogen projects to be built in Australia (ARENA, 2018). This investment will reduce the cost of hydrogen production and scale up the industry.

The United States’ Department of Energy published their National Clean Hydrogen Strategy and Roadmap in 2022, setting out strategies, opportunities and goals for the country’s green hydrogen future (DOE, 2022). 

With a goal of 50 million metric tonnes of clean hydrogen produced annually by 2050, the roadmap predicts that US emissions will reduce by approximately 10% from 2005 levels. Among the three strategies put forth, the Hydrogen Shot (launched in June 2021) has gained the most traction - this ambitious initiative aims to reduce production cost to USD1 for 1kg of hydrogen in 1 decade (111). This goal will be supported by investments in clean hydrogen hubs and electrolysis programmes. 

Prior to the publication of this roadmap, the Biden-Harris administration had successfully passed laws to galvanize the production of clean hydrogen. The Inflation Reduction Act (IRA) provided for policies and incentives, including a Production Tax Credit to encourage the proliferation of green hydrogen across industries (This tax credit will be further discussed in our next article).

The IRA has prompted several green hydrogen projects, including a USD$4 billion green hydrogen production facility in North Texas (the largest to date in the US) (S&P Global, 2022). With 1.4 GW of dedicated renewable power, the facility is expected to begin operations in 2027, providing clean hydrogen to industries and the mobility market. 

Now that we’ve explored the basis of green hydrogen projects and their driving factors, stay tuned for the next and final part of this series, where we’ll dive into the shortcomings of this climate neutral energy carrier.


This is the second article of a three-part series on the topic of green hydrogen as an alternative source of energy by Khor Reports.

By Nithiyah TAMILWANAN, Segi Enam Intern, 27 June 2023 | LinkedIn

Green Hydrogen: Part 1 - A Pathway to Decarbonization

1.5 Degrees Celsius. The World Meteorological Organisation (WMO) reported that we are on a path to breaching this key climate threshold set out in the 2015 Paris Agreement (CNN, 2023).

But why should we care? If global temperatures do, in fact increase by 1.5℃ to 2℃ from pre-industrial levels before 2050, we will witness catastrophic and potentially irreversible climate disasters. To prevent this reality, there is a pressing need to galvanize the transition to renewable energy sources. This will have the resounding result of decarbonization, thus minimizing GHG emissions.

Green hydrogen could be one of the world’s renewable energy hopes, keeping climate risks at bay. This three-part series seeks to demystify green hydrogen and answer all your questions on this up and coming energy carrier.

What is the significance of hydrogen?

Hydrogen, discovered by British scientist Robert Boyle in 1671, is the most abundant chemical structure in the universe (S. Griffiths et. al., 2021). It literally means ‘creator of water’ as the element only releases water upon combustion (IRENA, 2020). This factor has made it highly attractive as an alternative source of energy as it does not emit carbon dioxide during its production.

Similar to electricity, pure hydrogen can act as an energy carrier of high density, containing nearly three times as much energy by weight as natural gas, gasoline and diesel (US DOE, 2019). 

Throughout history, hydrogen has played a key role in several areas including its use in fuelling the first internal combustion engine, acting as storable fuel for travel to the moon, feeding populations through ammonia fertilizer, and supplying energy to the oil refining industry (IEA, 2019). 

However, hydrogen has only really started to contribute to the global energy mix in recent years as production and utilization technologies have improved, and countries all around the world have committed to net-zero carbon emissions by 2050 (Data-Driven EnviroLab & NewClimate Institute, 2020).

As observed in the chart below, the International Energy Agency (IEA) has recorded a stark increase in demand for hydrogen, which has tripled from 1975 to 2018 and continues to rise. In 2021, demand for hydrogen was approximately 94 million tonnes (Mt) (IEA, 2021).

Rise in demand for hydrogen since 1975 (IEA, 2019).

This increase in demand is attributed to a number of factors associated with the production and utilization of hydrogen that makes it a more viable energy source than its competitors.

What is green hydrogen? Is it truly a viable renewable energy option?

To answer this question, we have to demystify the types of hydrogen and their various methods of production.

Most people assume that hydrogen-based fuels and energy sources are non-carbon emitting as they only produce water from combustion. However, as depicted in the graph below, approximately 96% of global hydrogen production is sourced from fossil fuels. This results in nearly 830 million tonnes of CO2 emissions per year, equivalent to the emissions of Indonesia and the United Kingdom combined (IEA, 2019).

Sources of hydrogen generation (Khor Reports adapted from X. Li et. al., 2023).

World renowned energy organizations, such as the International Renewable Energy Agency (IRENA), utilize a color code nomenclature to describe the various methods of producing hydrogen based on its feedstock:

Shades of hydrogen (IRENA, 2020).

Of the four shades, it is evident that green hydrogen is the only realistic pathway to low-carbon emissions throughout the production process. Blue hydrogen does provide for the added fixture of carbon capture and storage at estimated levels of approximately 80-90%. However, in reality, these high levels of capture have yet to be achieved. Turquoise hydrogen results in the solidification of CO2 (carbon black), thus negating emissions, but production is still very much at its pilot stages (Philibert, 2020). 

With such potential, industry players and academicians have deemed green hydrogen as a ‘critical part of a sustainable energy future’ and ‘key to decarbonizing hard-to-abate sectors like steel manufacturing, shipping and aviation’ (RMI, 2021).

However, up until 2019, IRENA reported that there has been no significant production of hydrogen from renewable sources, and that it had been limited to demonstration projects. But the status quo is quickly changing.

If this article has piqued your interest in green hydrogen and its potential in facilitating net-zero emissions, stay tuned for our second article where we discuss the driving factors of the recent green hydrogen wave.


This is the first article of a three-part series on the topic of green hydrogen as an alternative source of energy by Khor Reports.

by Nithiyah TAMILWANAN, Segi Enam Intern, 26 June 2023 | LinkedIn